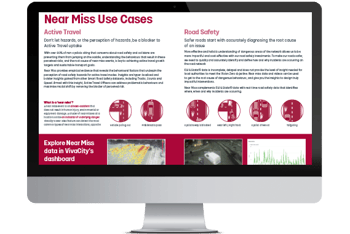
VivaCity Near Miss Detection
Real-time road safety insights and incident root cause analysis
Revolutionary Insights for Road Safety & Active Travel
VivaCity’s Near Miss detection is a road safety game-changer and a key feature of our innovative Smart Road Safety solution. With Near Miss it’s possible to detect and analyse a range of dangerous interactions that could have led to collisions, where they happen, and in real time.
How do VivaCity sensors detect near miss events?
To automatically detect near miss events, speed and path data of road users are analysed using three metrics: Proximity, Post Encroachment Time and Time to Collision.
By using not one, but three methodologies of analysis, and applying specific thresholds, it's possible to both identify near miss events and the root cause of the incident, with high accuracy and efficiency.
Near Miss Detection Methodologies

Proximal

Post-Encroachment Time (PET)

Time to Collision (TTC)

Make the right decisions with trusted data
Near Miss provides objective and unbiased data through consistent near miss measurements.

Quickly discover road safety hazards & intervene early
Understand where, when, why, and how near miss interactions are taking place and proactively intervene.

Support evidence-based decision making
Justify expenditure on road safety interventions and prove results of schemes to stakeholders.

Post-intervention analysis
Compare near miss counts before and after an intervention to measure effectiveness.
Don't let hazards - or perceived hazards - be a blocker to active travel


How Near Miss supports Active Travel schemes
- Real-time road safety data
- Near miss detection and data for incidents involving Active Travel modes
- Quantify human subjectivity about perceived dangers or hazards
- Easy to understand data insights to support Active Travel provision
- Comprehensive dashboard with visual outputs to communicate impact
Cost effective Road Safety interventions
Safer roads start with accurately diagnosing the root cause of an issue


How Near Miss supports Road Safety schemes
- Complement KSI & Stats19 data with real-time road safety data
- Identify where, when and why incidents are occurring
- Evaluate and quantify dangerous manoeuvres and understand severity
- Use visual aids to illustrate dangerous behaviours
- Identify the most efficient and cost-effective interventions
Cyclist's Way Blocked
When a cyclist’s way is blocked by an obstruction e.g - a parked car
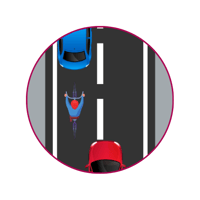
Problematic Pass
When a motorist gives too little space when overtaking a cyclist
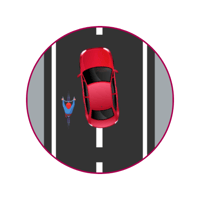
Vehicle Pulling Out
When a driver pulls out or in across another vehicle's path

Unsafe Intersection Crossing
When a pedestrian crosses at an unsafe point and the driver continues straight
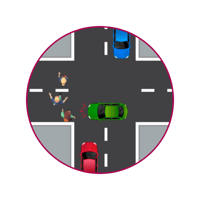
Near Left / Right Hook
When a motorist turns left/right across the pedestrian's path

Tailgating
When a driver follows another vehicle too closely without passing

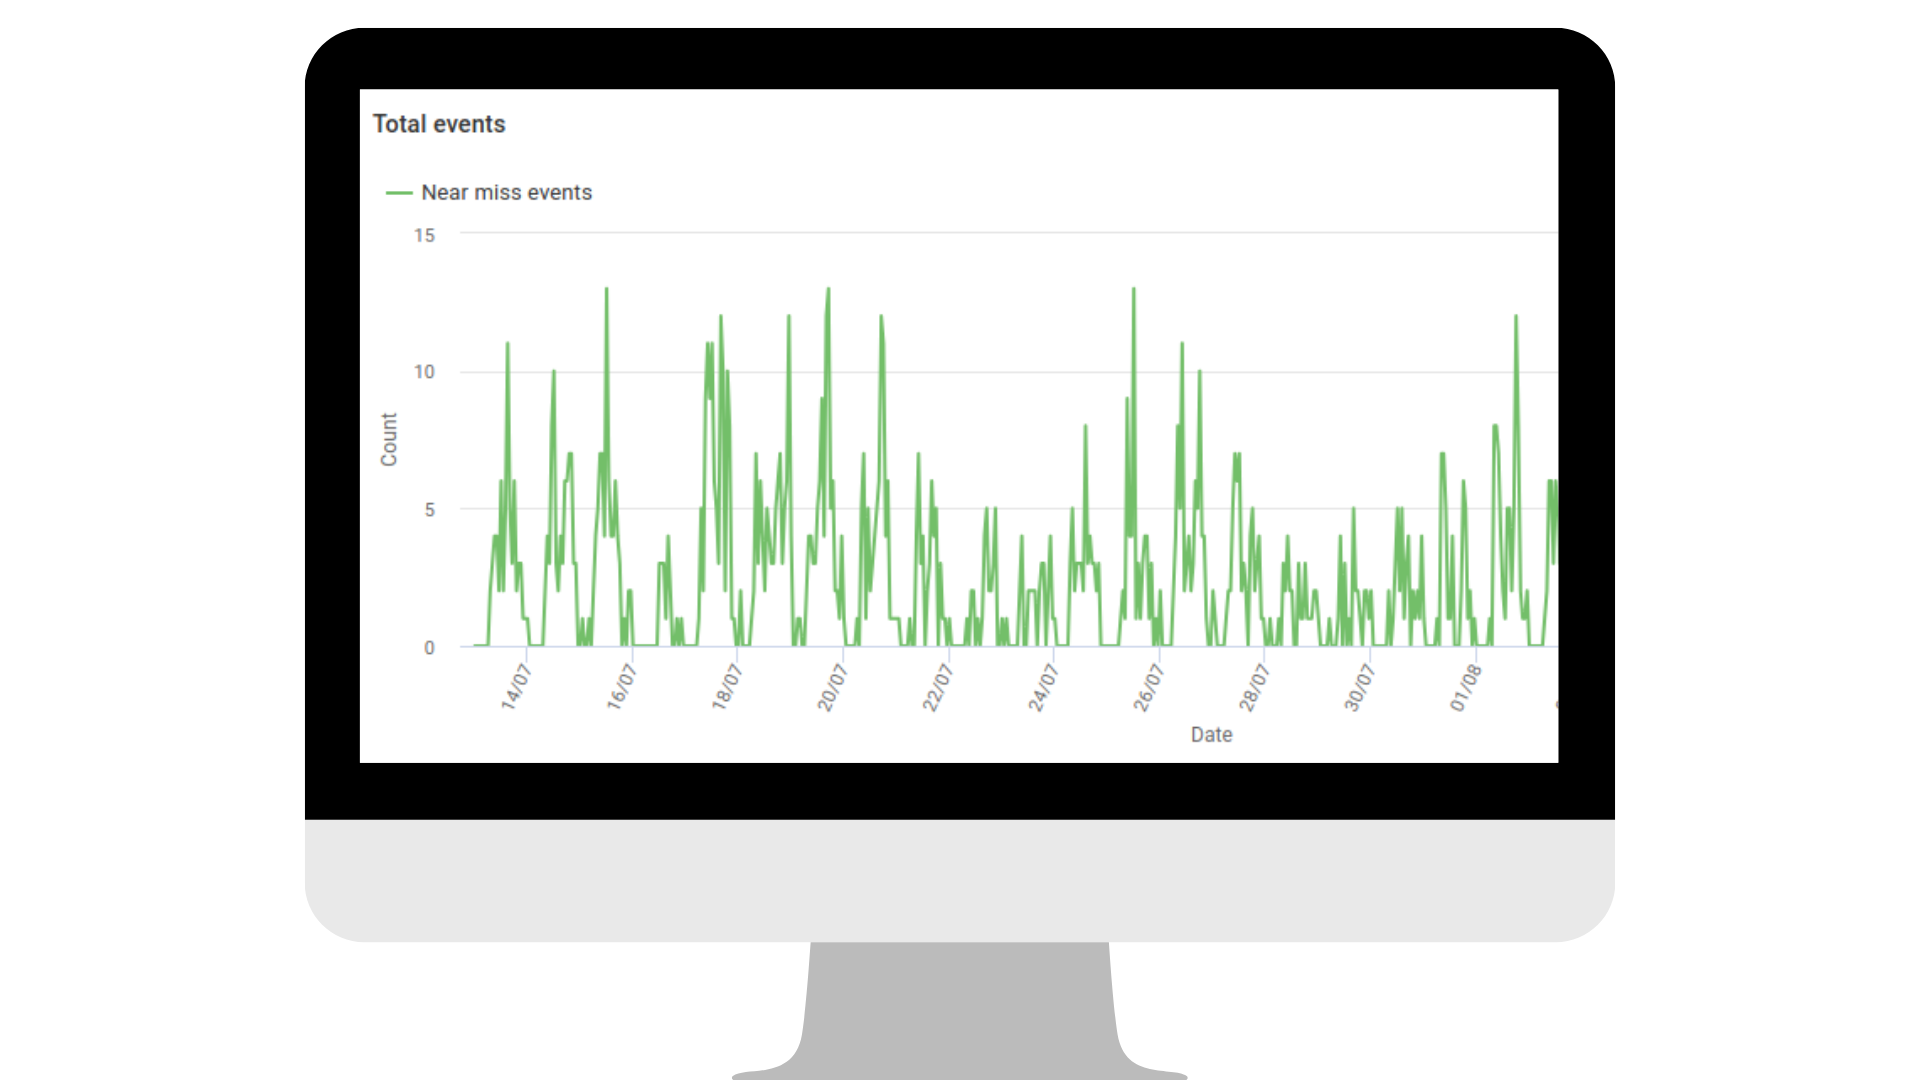
Near Miss Counts and Trends
Identify trends in dangerous interactions and behaviours, including comparing total near miss events per hour for a selected time range, average per day of the week and average per hour of the day.
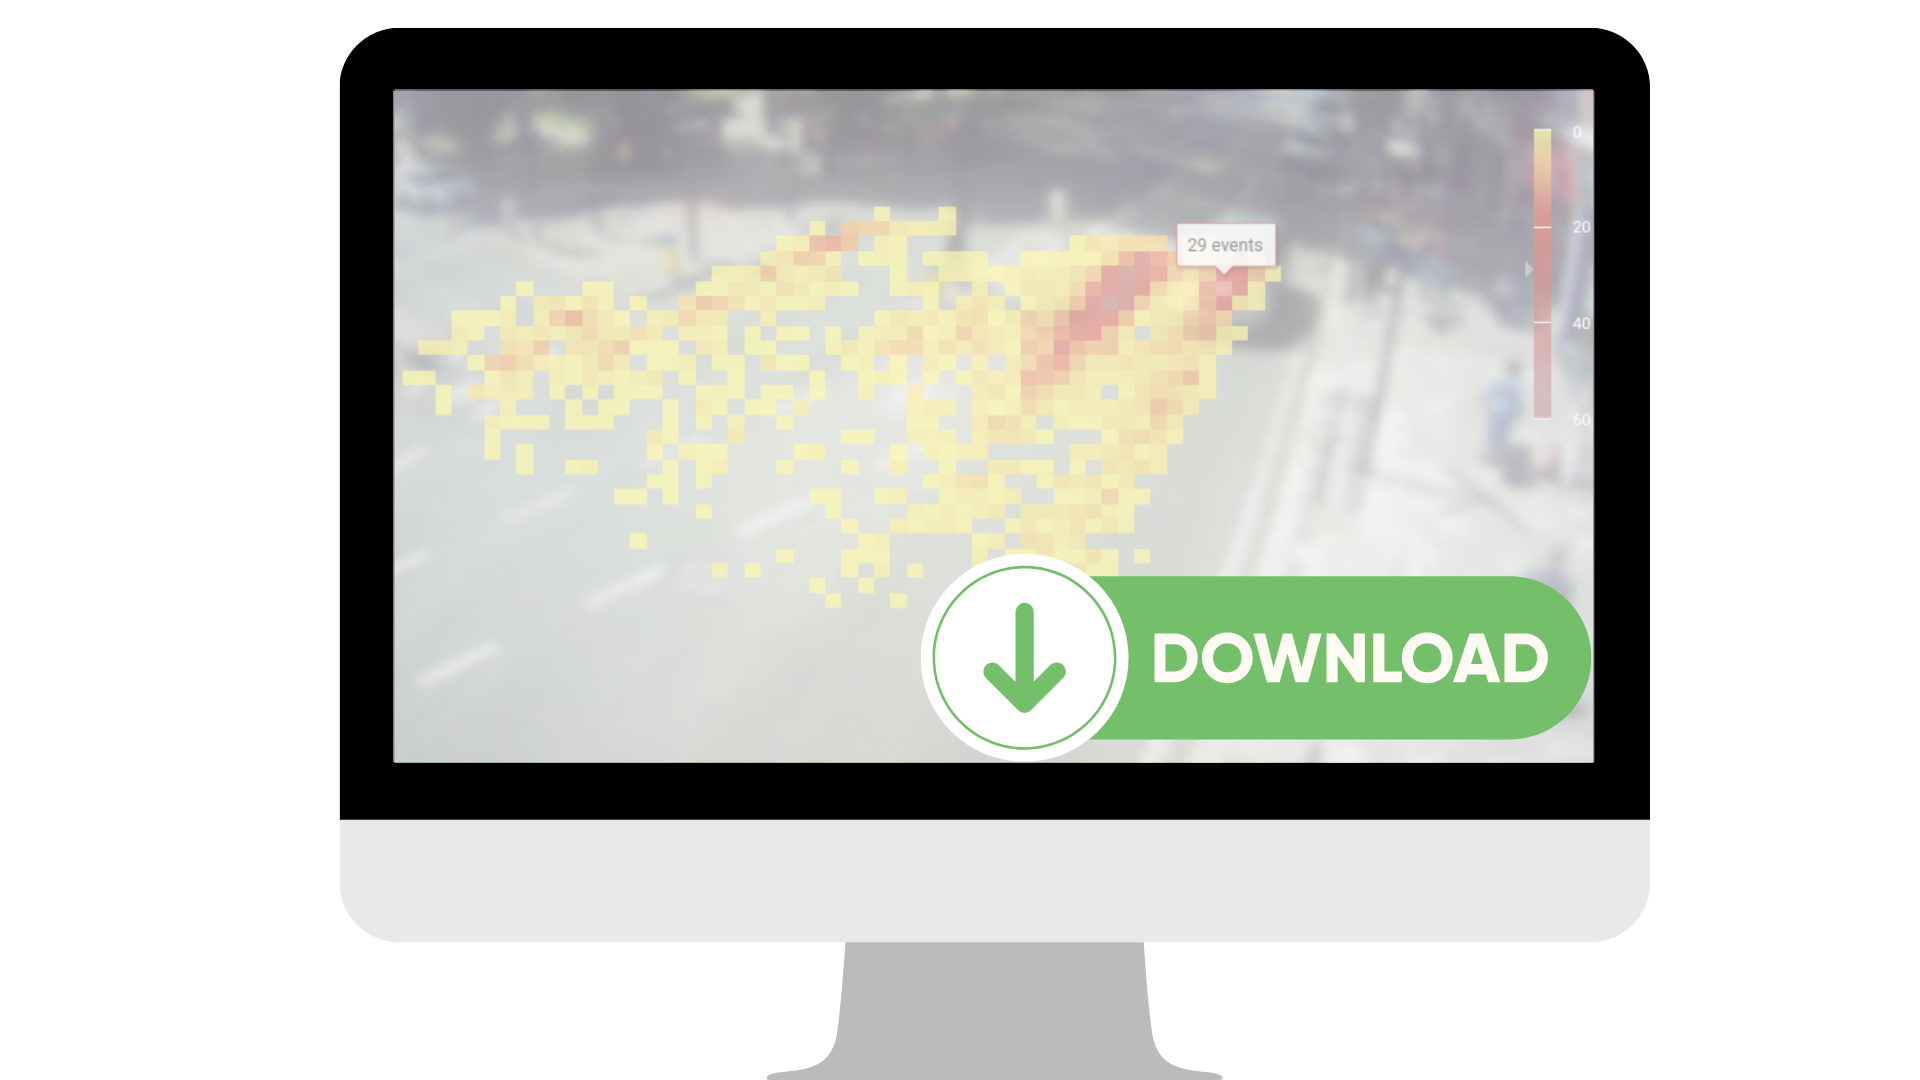
Near Miss Heatmaps
Visualise where near miss events are occurring in the road space with a heatmap of event density. Download heatmap images to use as evidence for intervention.
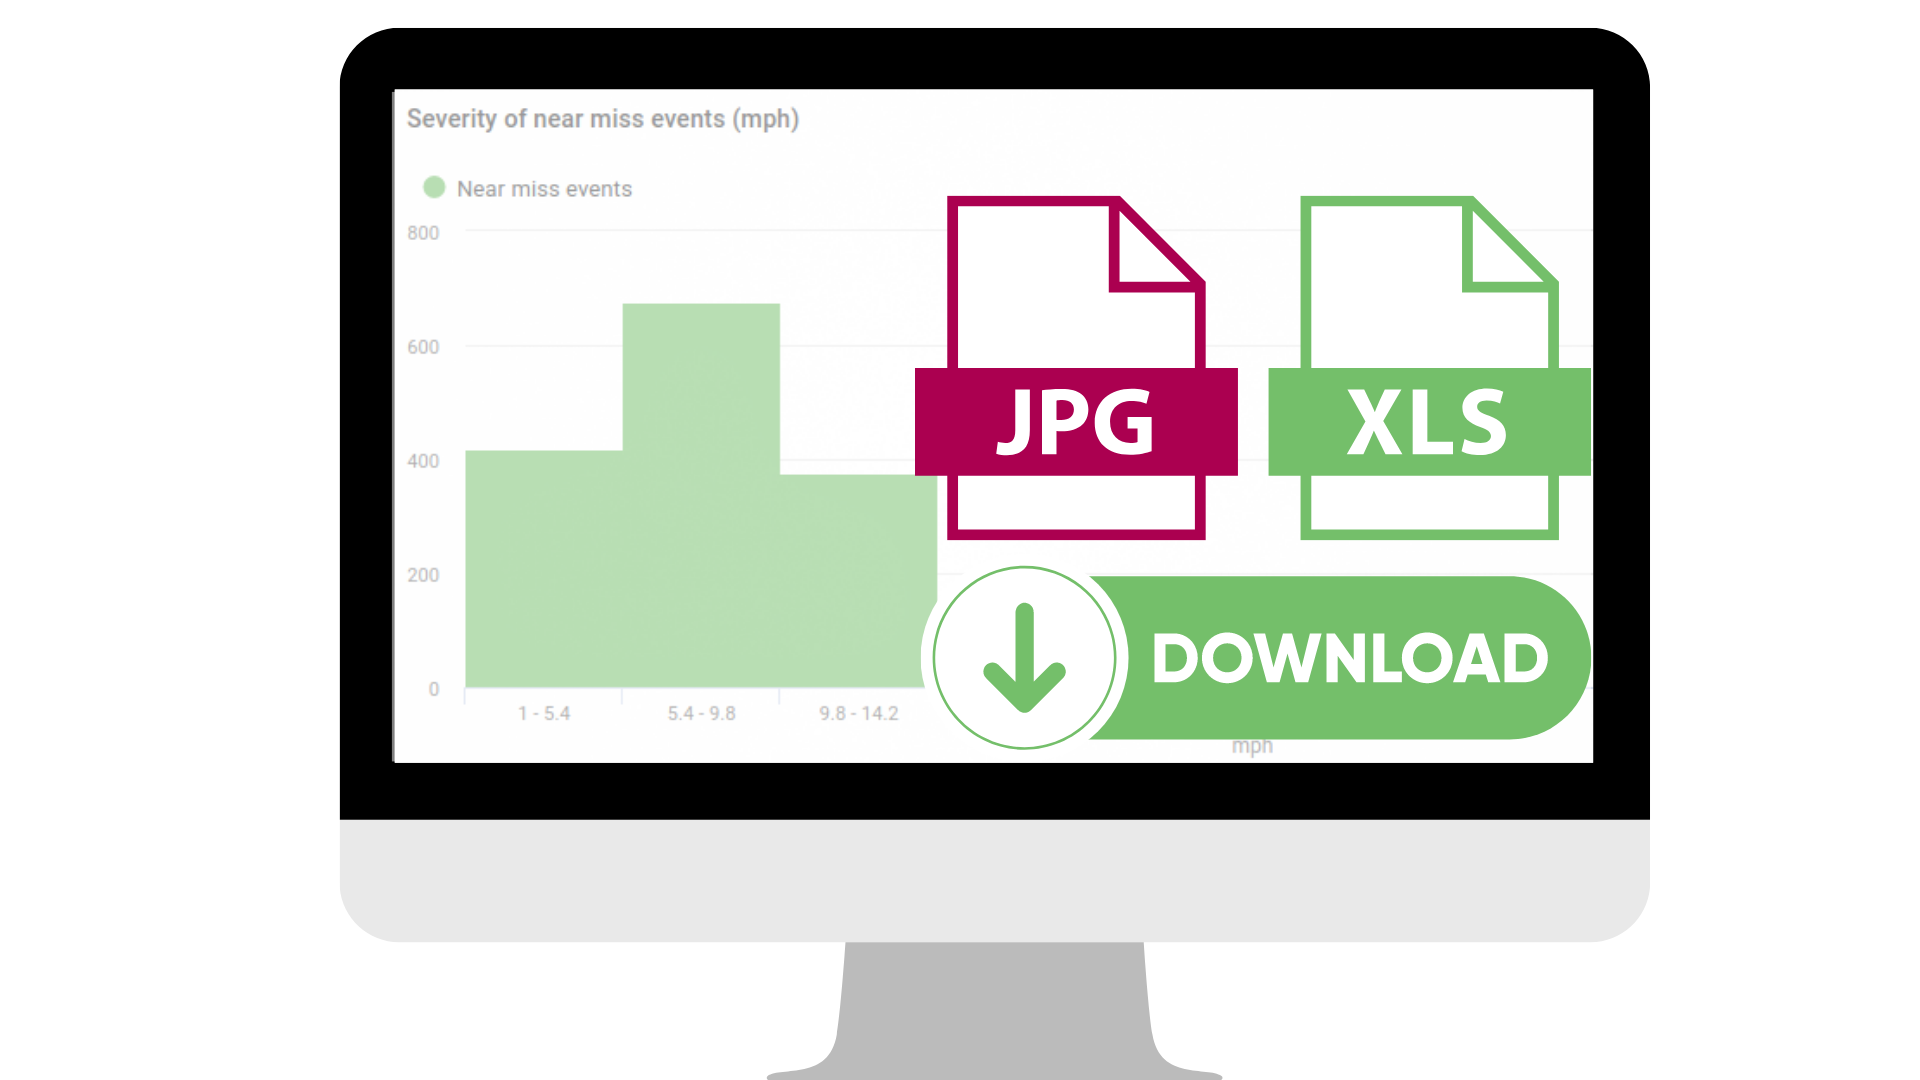
Download Charts and Underlying Data
Use VivaCity's intuitive analysis tools to create custom charts. Download the charts you create as images or raw data to help communicate key analysis to stakeholders and the general public.
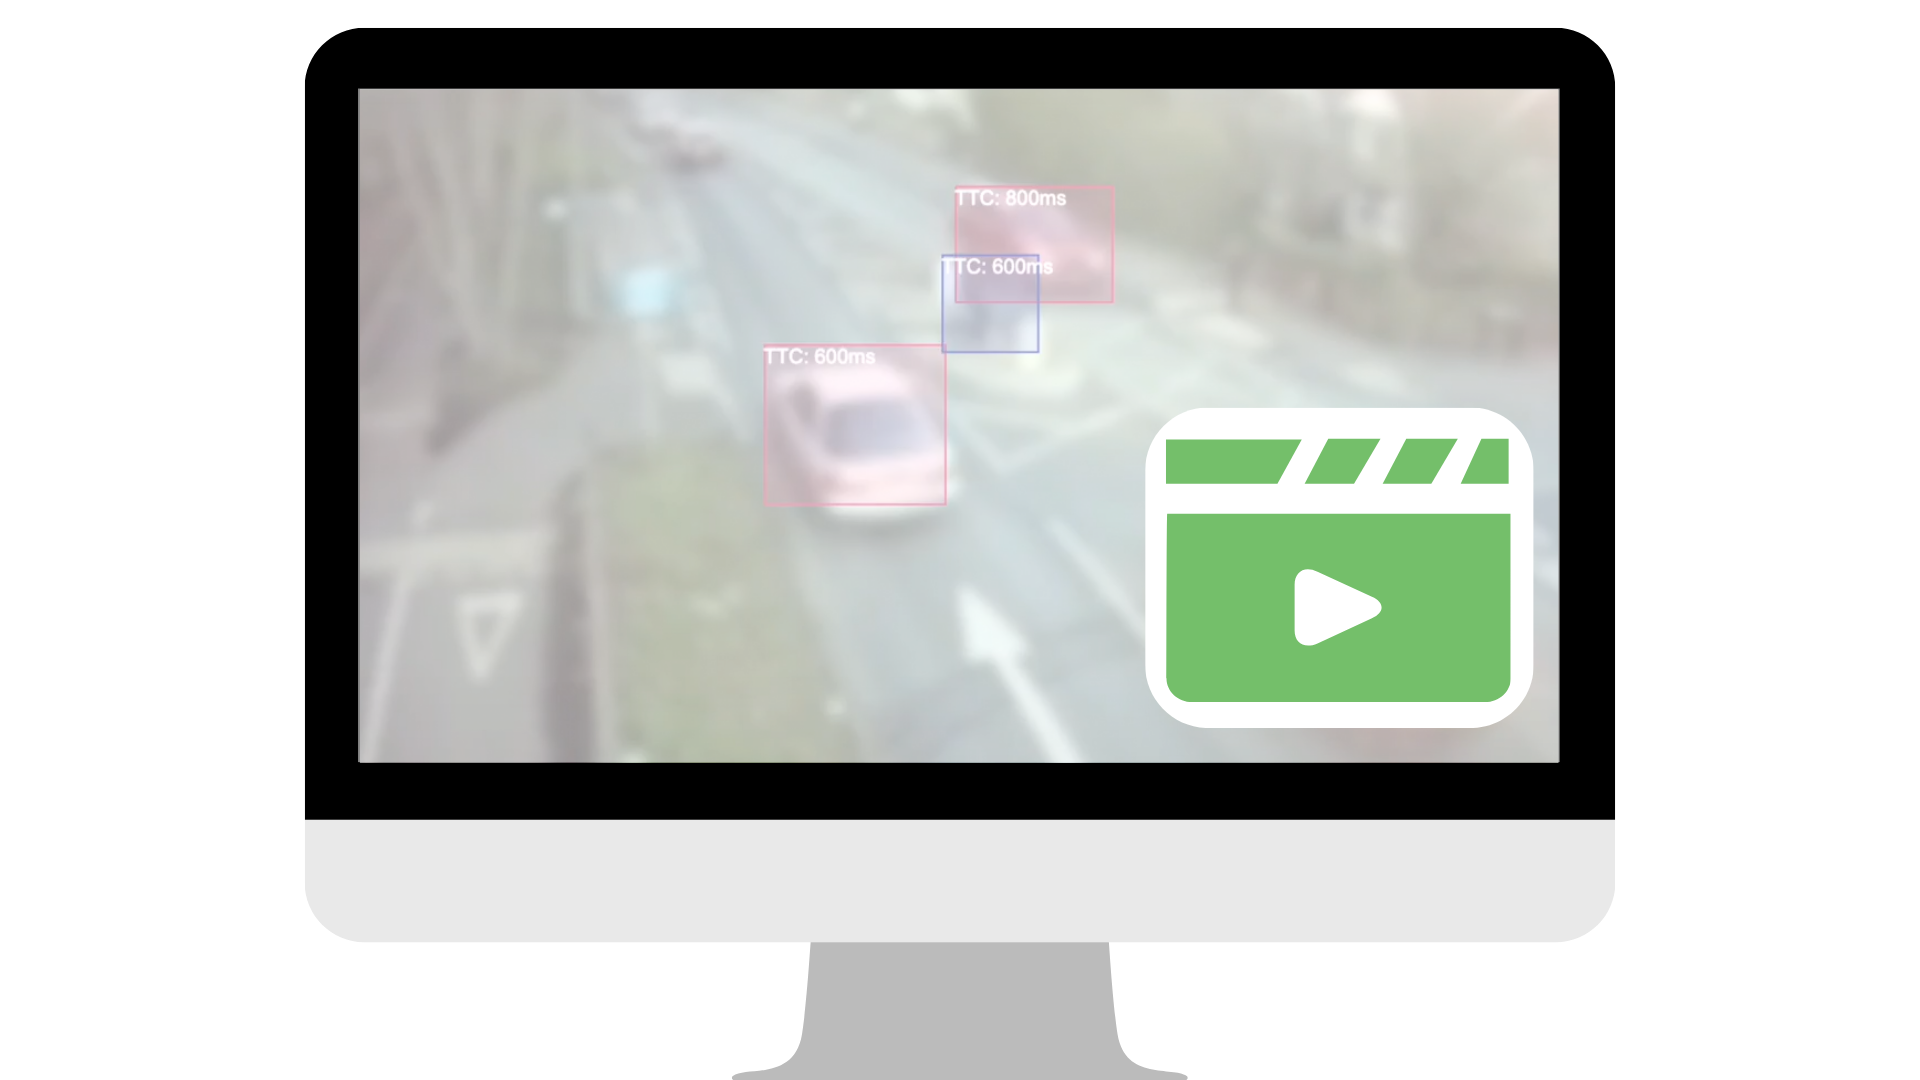
View Video Clips
View anonymised blurred video clips of near miss incidents for further insight into the event.
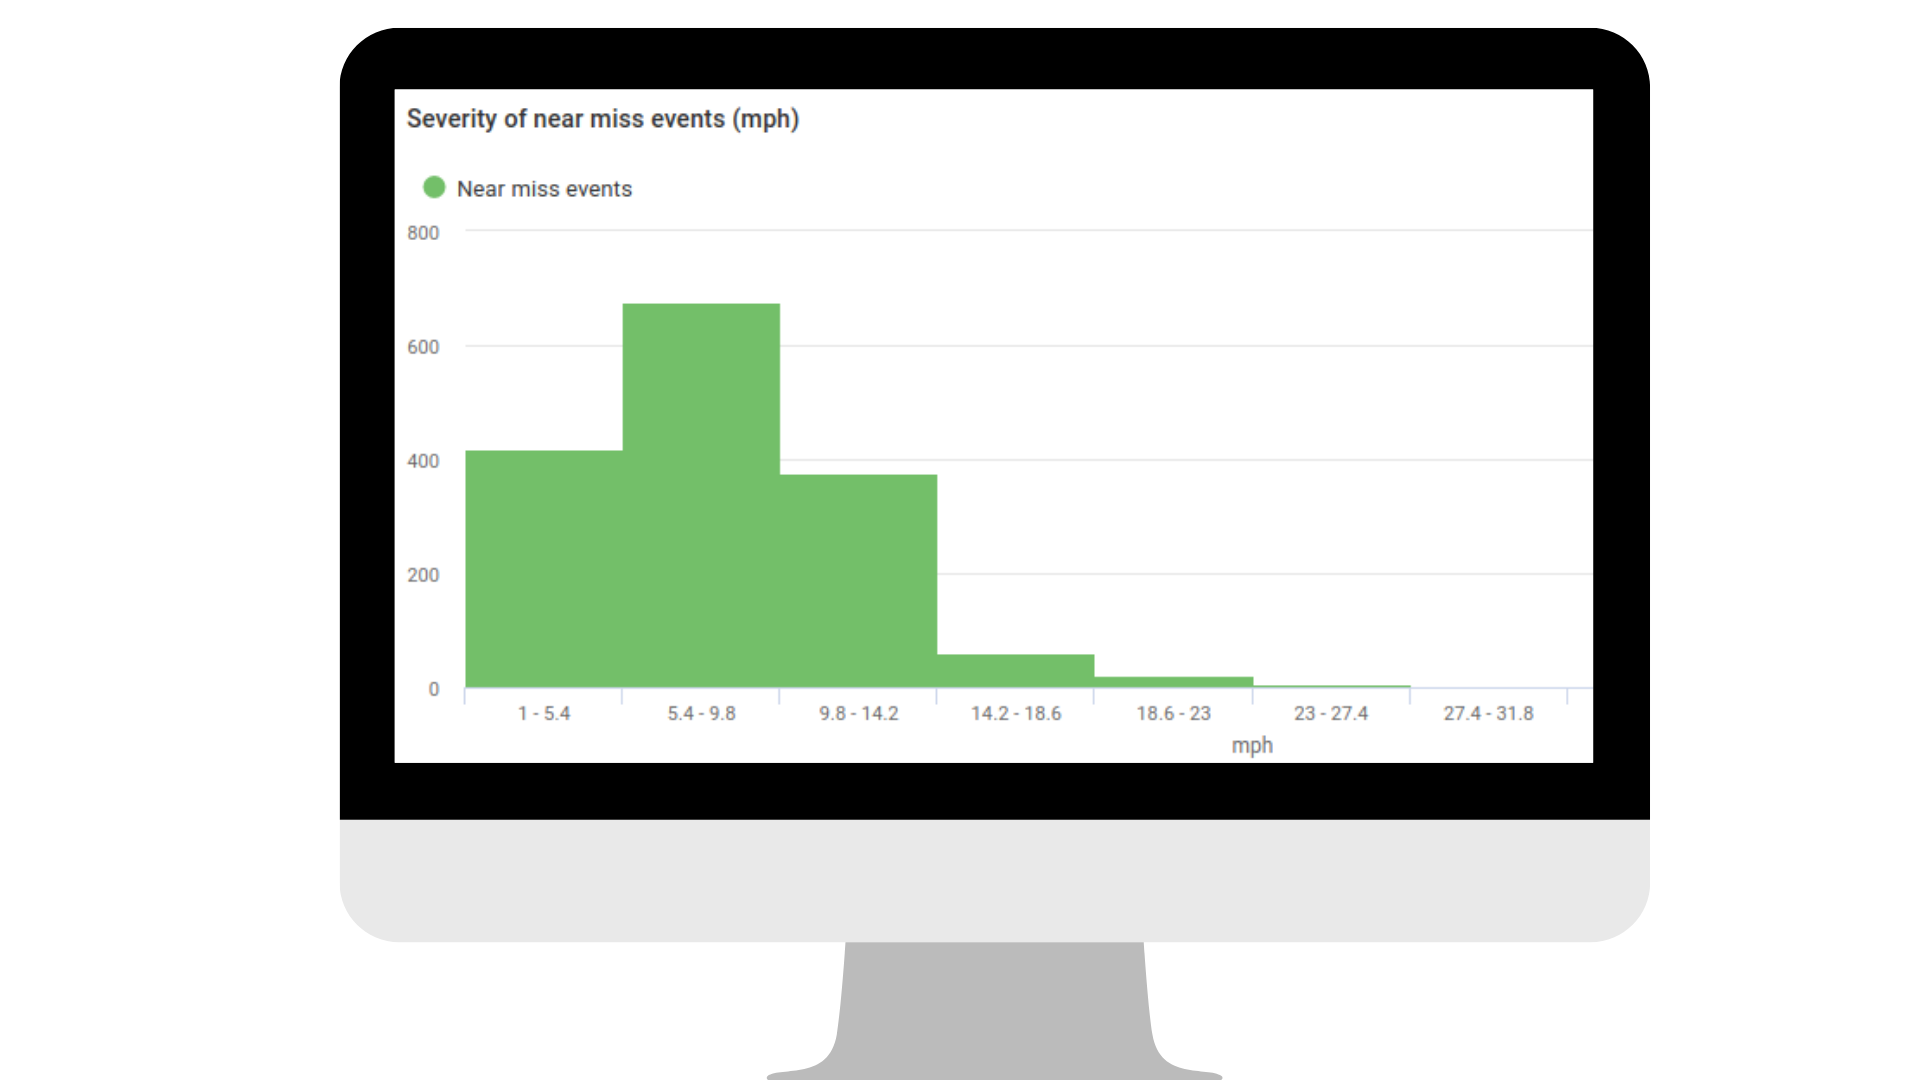
Severity Estimates
Use severity estimates to prioritise interventions based on safety risk, underpinned by data evidence.

Discover how Oxfordshire County Council are using Near Miss to understand near miss events involving cyclists at a busy junction, and how these insights are informing their Vision Zero strategy.
Download the Full Case Study Now
A selection of our clients and partners


